Time Profiler in Instruments (along with other instruments) is a great tool for profiling iOS application. It has a number of options, which are not described anywhere. The official documentation only touches the surface of Instruments; there is more information in WWDC videos, but it’s not quickly accessible in that form. Here’s a short list of findings that I inferred myself:
Time Profiler samples
If you zoom in close enough on the application’s time profile results, you’ll see individual samples, which look like letters in a circle. Apparently they describe the thread state: B — blocked, blue R — running, red R — runnable:
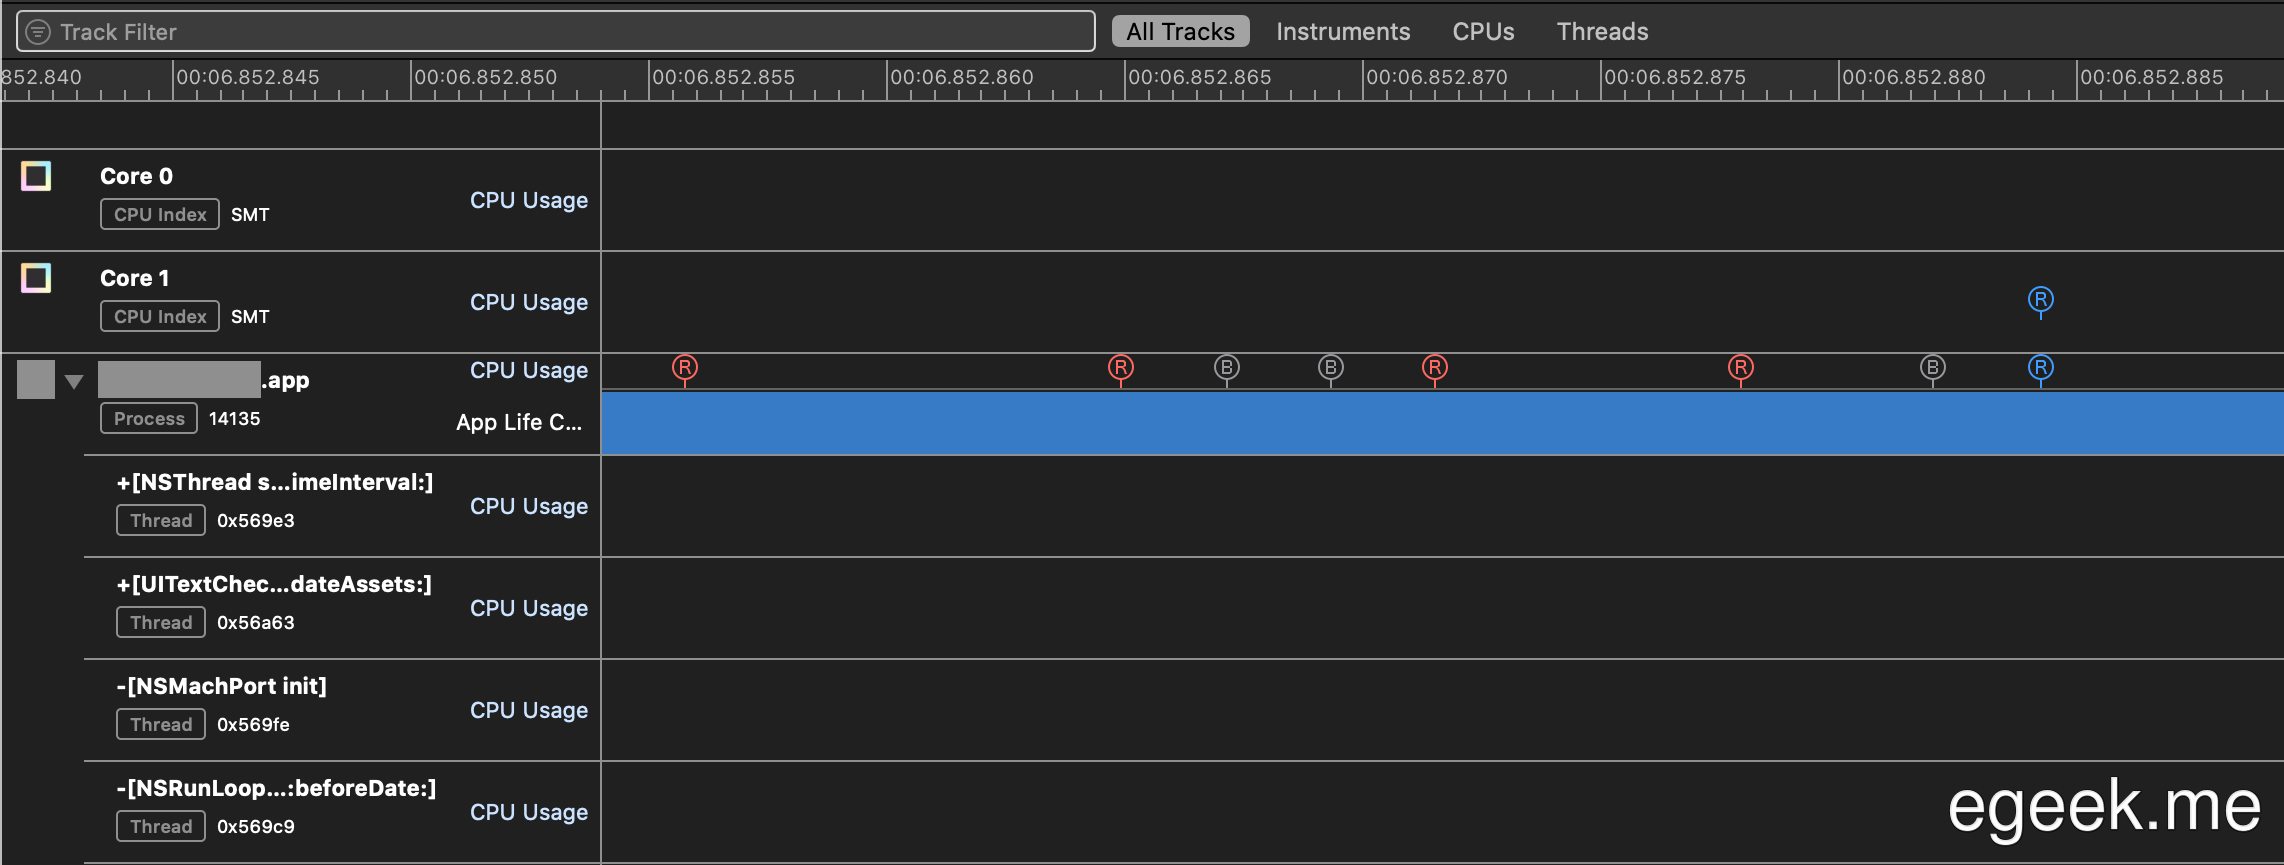
At least this was true in Xcode 11.7, but now I can’t see red R symbols anymore in Xcode 12.4, the runnable state is also represented by blue Rs.
More visible information
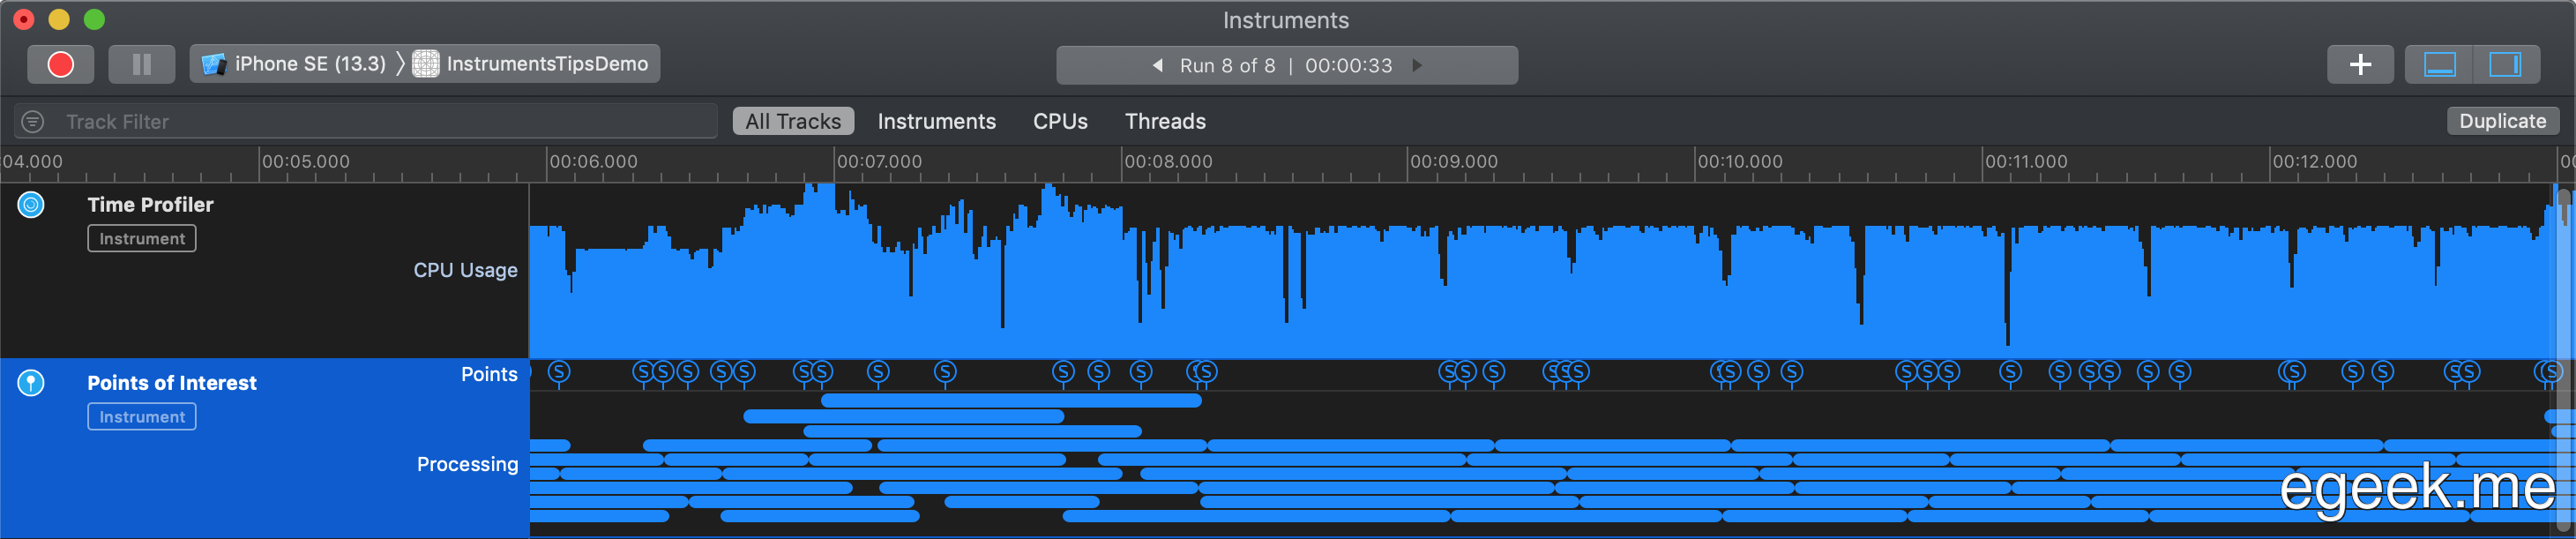
The Signposts instrument is helpful to get more information about what logic the program is doing. The result strip may display a bunch of regions close to one another:
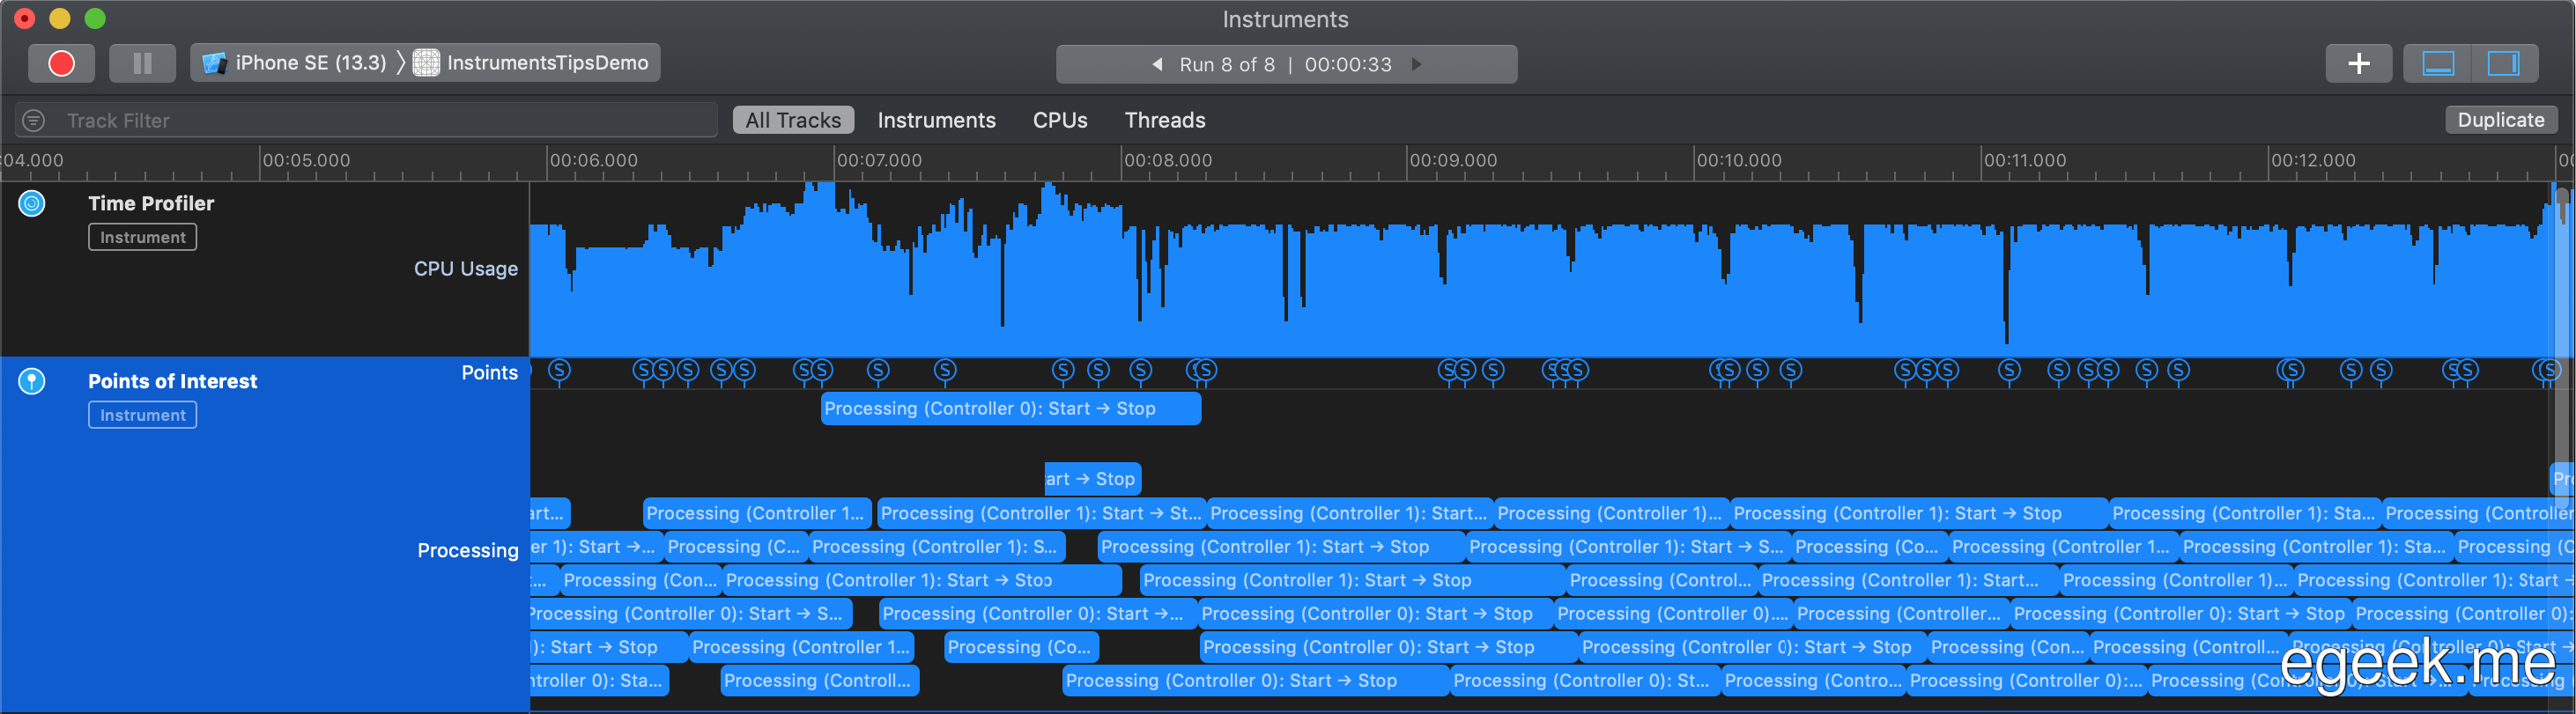
If you expand the instrument’s vertical space (by dragging the divider between it and the next instrument down), you’ll see more information, including some region descriptions:
Signposts overview
When you hover over the timeline at the top, Instruments displays details for every event at that time:
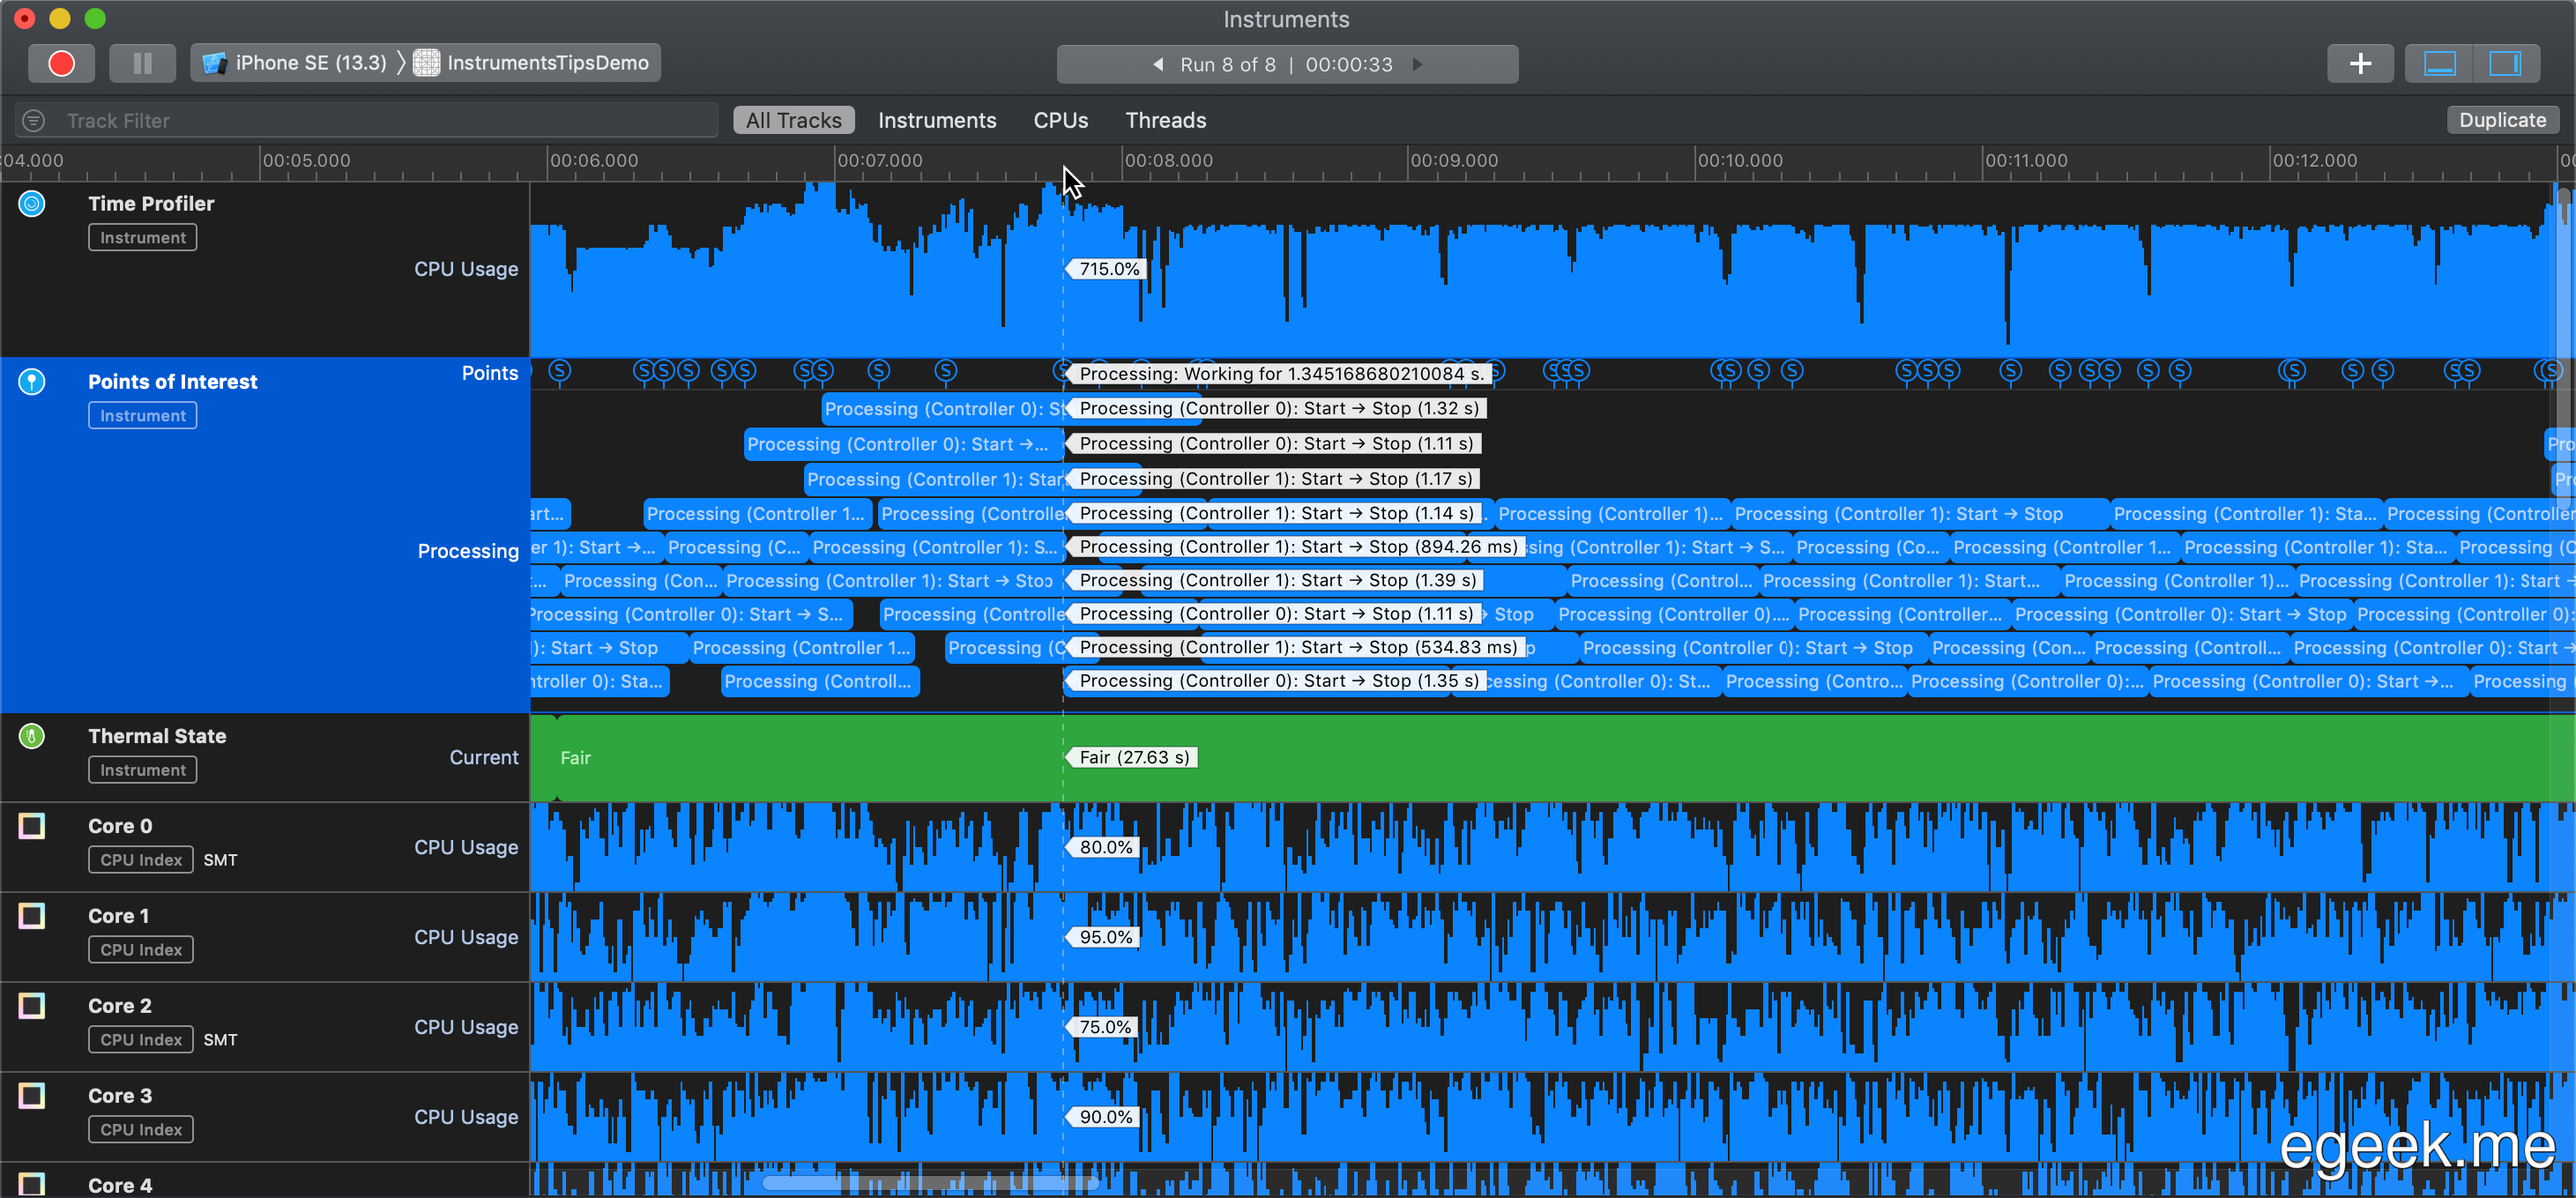
(The cursor image is from https://micheljansen.org/blog/entry/1317).
Allocations: heap + VM regions.
The Allocations instrument is used to track memory usage of a program. The resulting statistics shows kinds of objects which were allocated during the run, however the first three items aren’t so clear. They are “All Heap & Anonymous VM”, “All Heap Allocations” and “All Anonymous VM”:
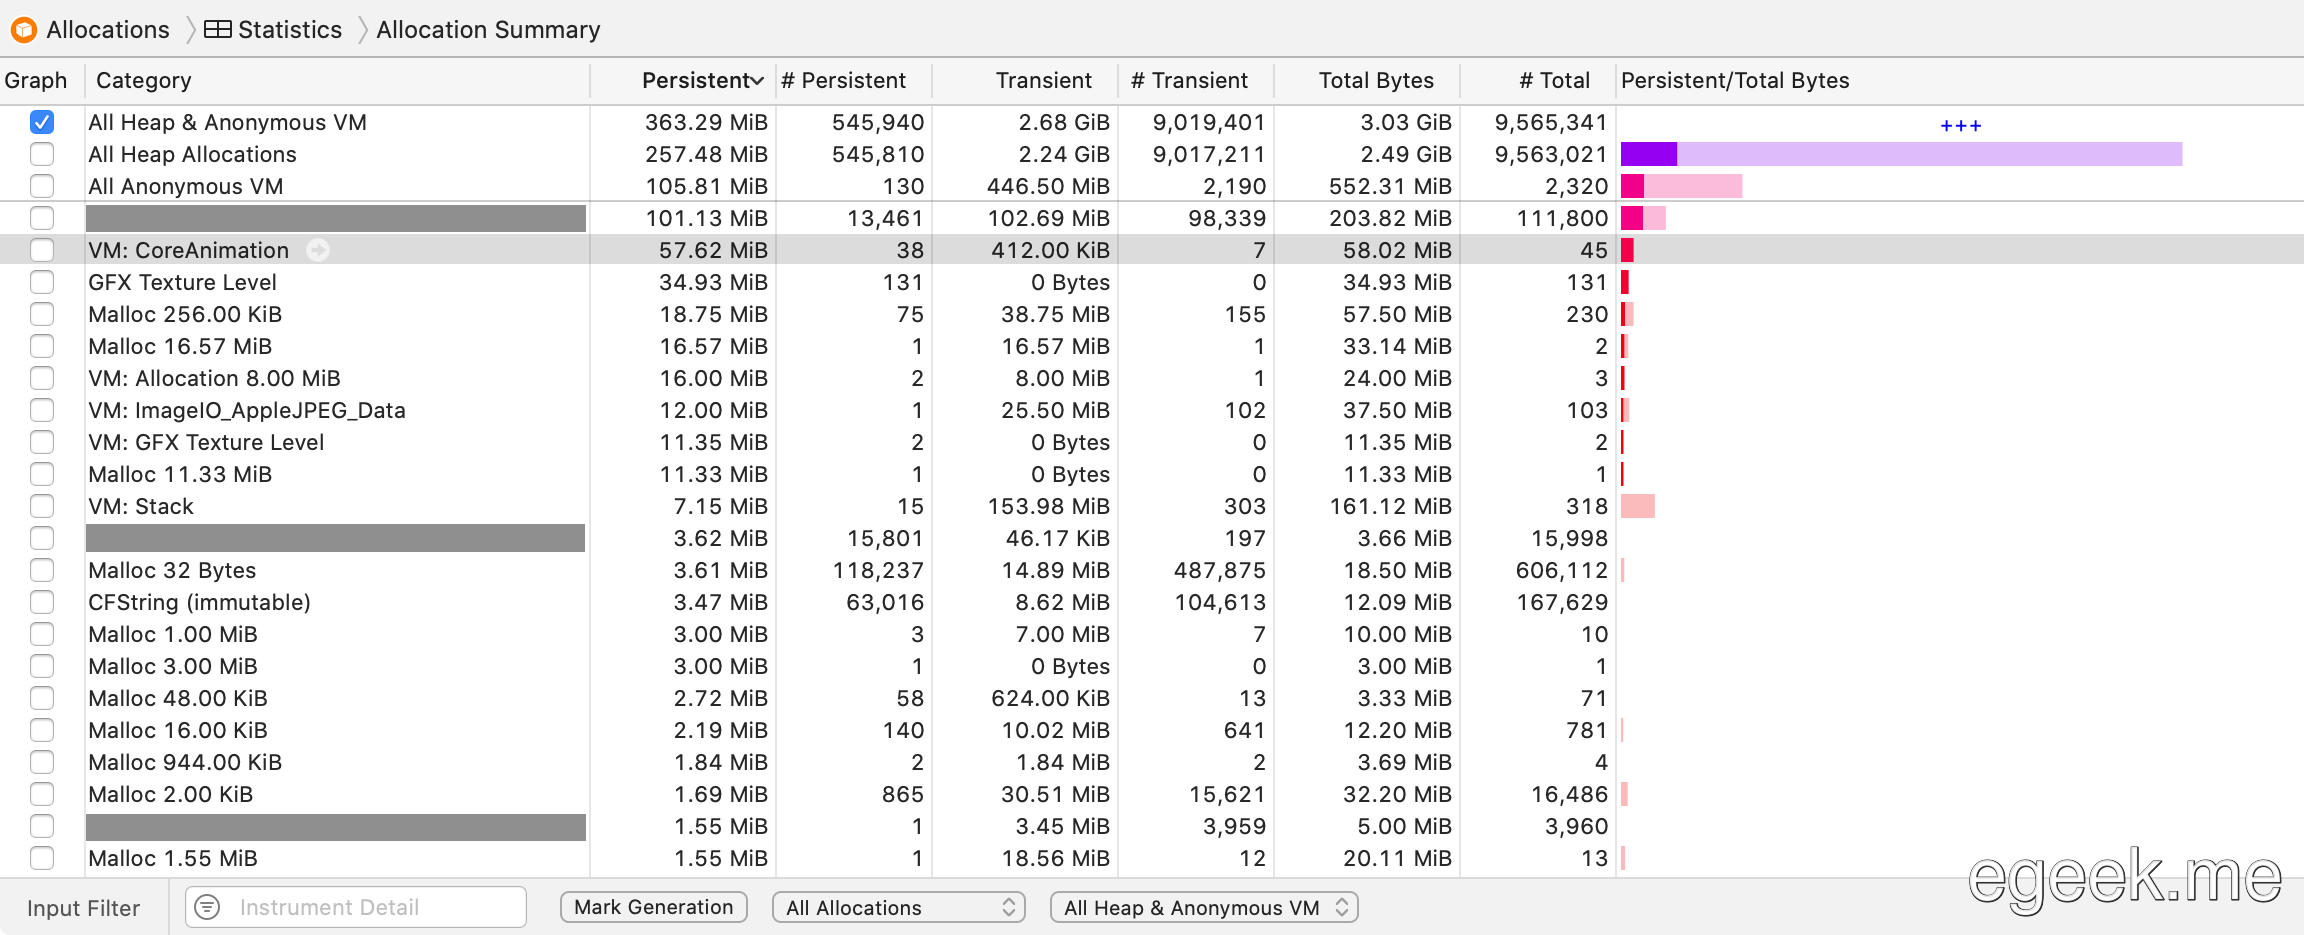
First, the item “All Heap & Anonymous VM” is the sum of the other two items. Second, the VM (Virtual Memory) regions are probably memory allocated by the system like dynamically-loaded libraries, textures and memory-mapped files.
Busted: PoI’s lines
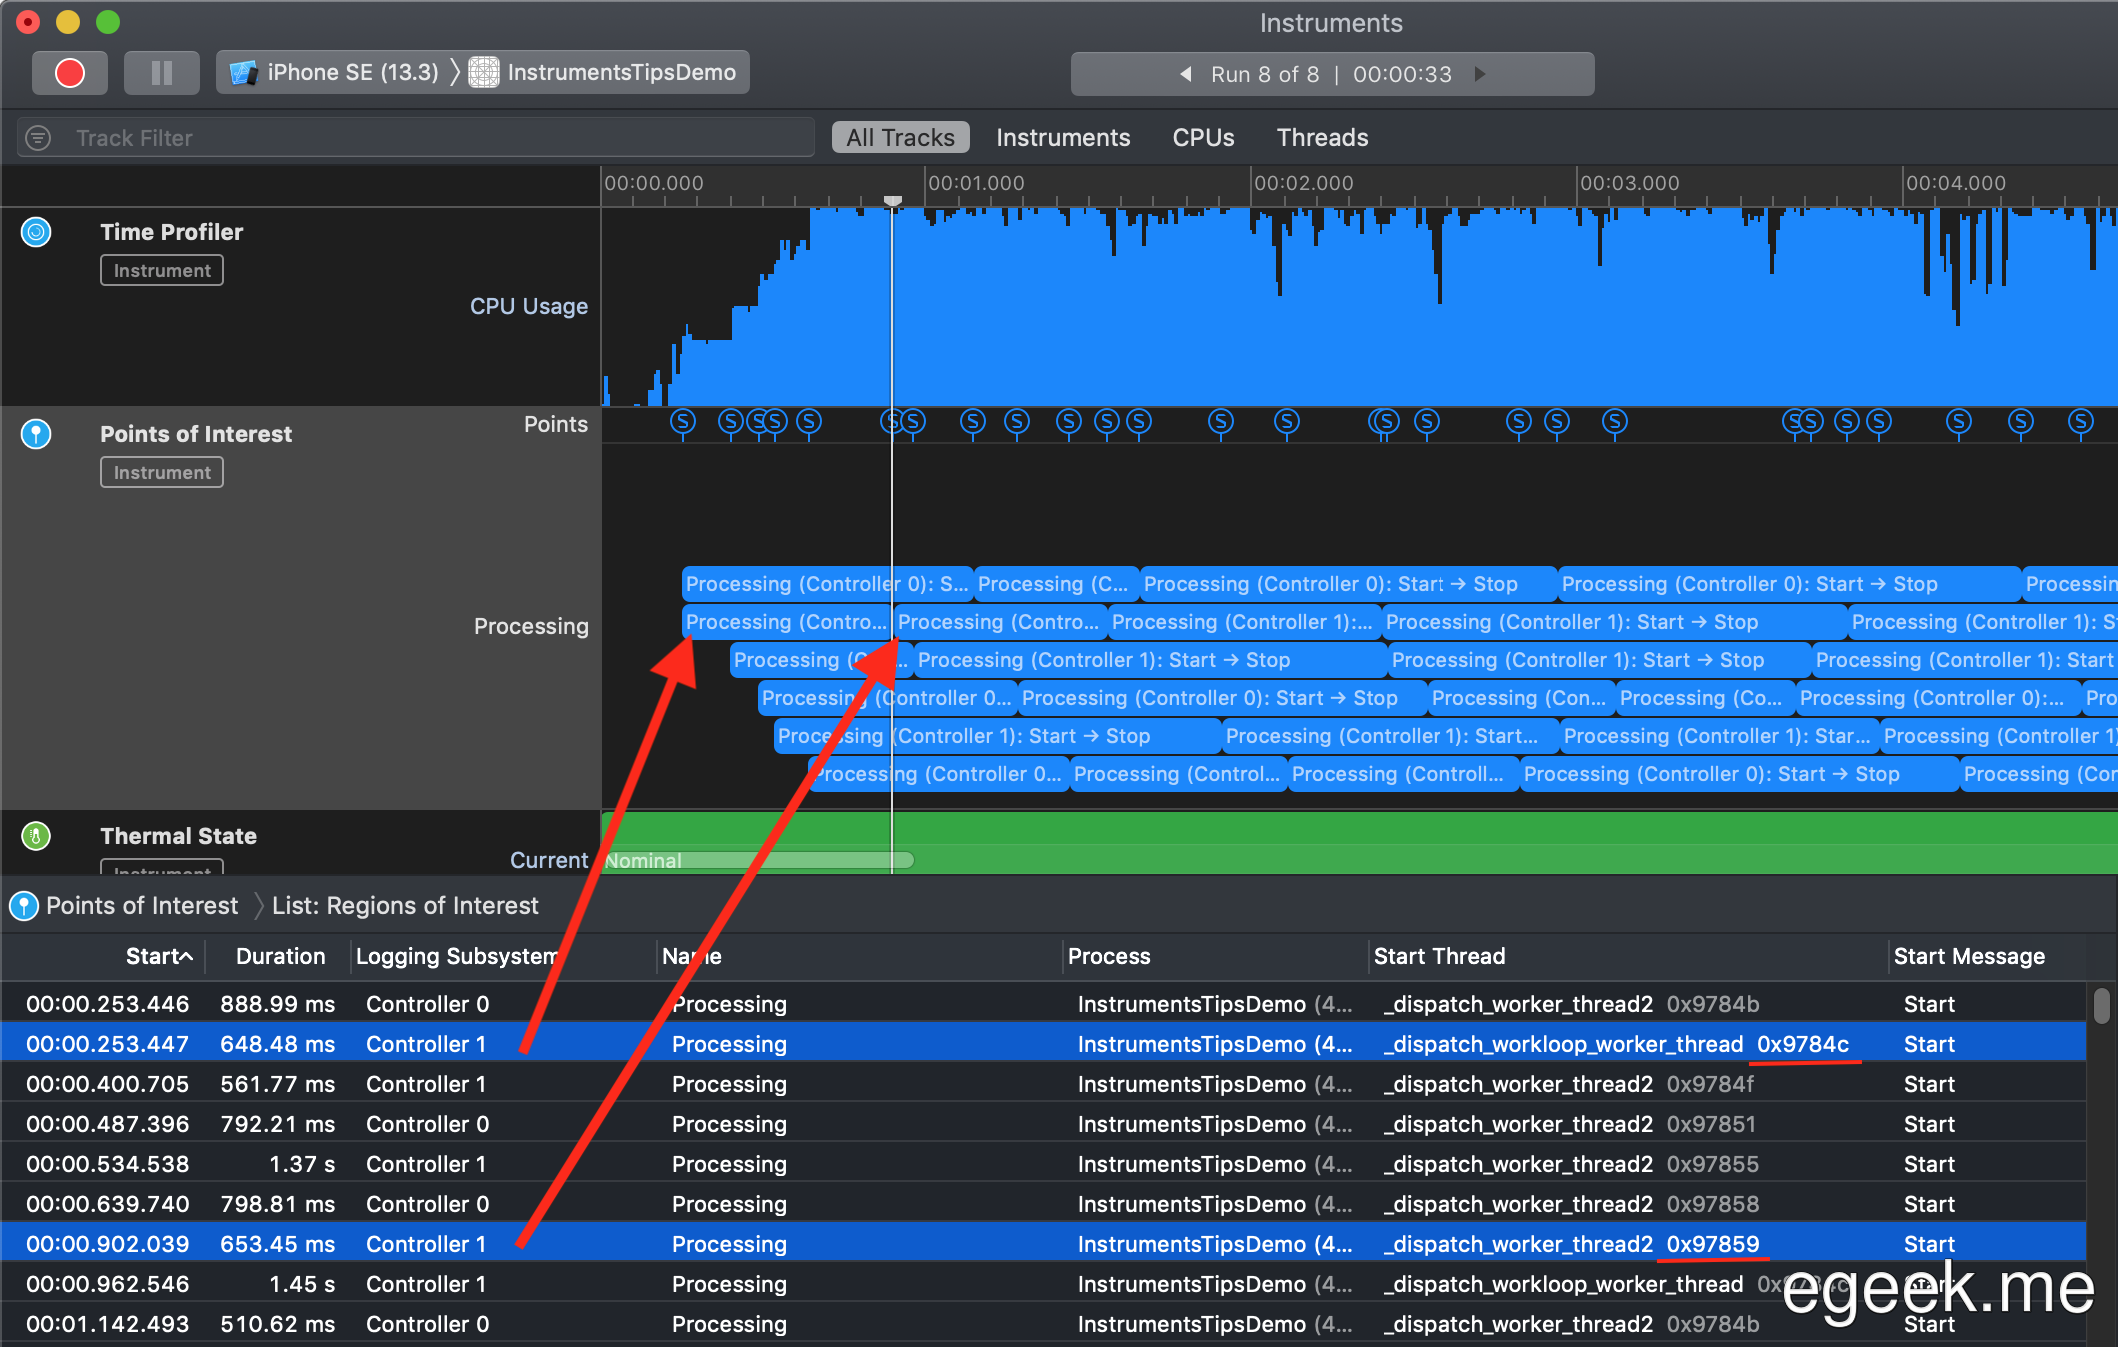
Based on signpost results of another program, I thought that the Points of Interest’s lines correspond to worker threads where one line corresponds to a specific thread. But a quick prototype showed that this was not the case:
PS
Here’s a couple of useful WWDC videos about using Instruments: